The Comprehensive List of Fundraising Statistics for 2021
Looking for a major source to find all the fundraising statistics you need? You’ve come to the right place! Check out our robust list of stats below by category:
- Charitable Giving
- Corporate Giving & Matching Gifts
- Volunteering
- Online Giving
- Crowdfunding
- Recurring Giving
- Social Media Fundraising
- Mobile Giving
- Email Fundraising
- Direct Mail Fundraising
- School Fundraising
Understanding this data is critical to your nonprofit’s success. After all, there may be other areas of fundraising you didn’t realize could have such a huge impact! Let’s jump in.
Charitable Giving Statistics
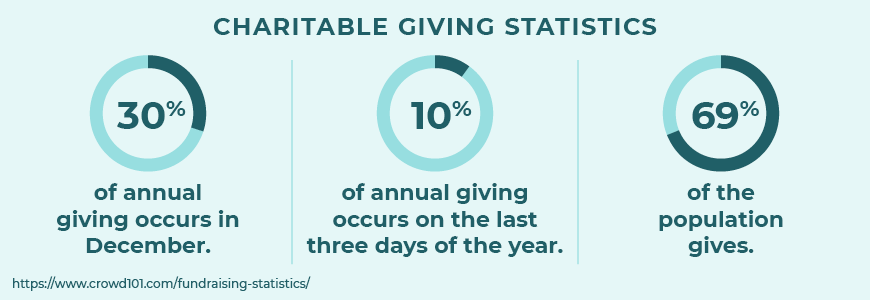
Stat: 30% of annual giving occurs in December.
Impact: The end of the year’s “giving season,” as it tends to be called, is a prime opportunity for nonprofits to fundraise.
Stat: 10% of annual giving occurs on the last three days of the year.
Impact: Most donors feel extra generous the last three days of the year, due to the holiday season and potential tax benefits. Take advantage of this time for your nonprofit.
Stat: 64% of donations are made by women.
Impact: Women make up a majority of the donor population and serve as an impactful source of support.
Stat: 69% of the population gives.
Impact: A vast majority of people contribute to charitable organizations, which means there are many sources of support you can look into.
Stat: 31% of donors worldwide give to organizations located outside of their country of residence.
Impact: Your organization isn’t limited to support from the country in which you operate. Many donors will give across national borders.
Stat: 41% of donors give in response to natural disasters.
Impact: Natural disasters have a tendency to bring about wide support during those times of need.
Stat: 60% of Millennials donate an average of $481 to nonprofits each year.
Impact: Millennials make up a large portion of donors in the population, and tend to be generous with their contributions.
Stat: Individuals who earn $25,000 or less donate the largest share (16.6%) of their income to charity.
Impact: Individuals with lower incomes tend to be more generous proportionally with their donations.
Corporate Giving & Matching Gift Statistics
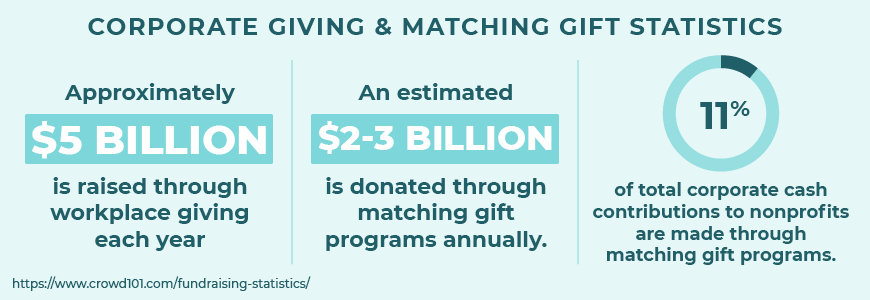
Stat: Approximately $5 billion is raised through workplace giving each year.
Impact: Workplace giving is an excellent opportunity for nonprofits to tap into.
Stat: 90% of companies indicate that partnering with reputable nonprofit organizations enhances their brand, and 89% believe it leverages their ability to improve the community.
Impact: Many companies benefit from offering corporate giving programs, while simultaneously enhancing their surrounding communities.
Stat: An estimated $2-3 billion is donated through matching gift programs annually.
Impact: Matching gift programs are a popular form of corporate giving and an excellent opportunity for nonprofits.
Stat: 88% of companies believe effective employee engagement programs help attract and retain employees.
Impact: Companies can keep their employees happy and engaged by offering corporate giving programs that get their employees involved and benefit the greater good.
Stat: 11% of total corporate cash contributions to nonprofits are made through matching gift programs.
Impact: A good portion of money that companies give to nonprofits is contributed through matching gift programs, which means organizations have a compelling reason to tap into this form of corporate philanthropy.
Volunteering Statistics
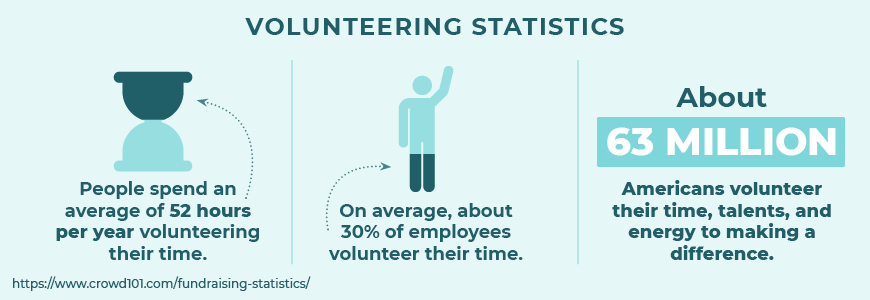
Stat: About 63 million Americans—which is 25% of the adult population—volunteer their time, talents, and energy to making a difference.
Impact: Large numbers of Americans commit their time to helping organizations, which means there are many opportunities for your team to recruit dedicated volunteers.
Stat: 72% of volunteers are involved with only one organization, while 18.3% are involved with two.
Impact: While most volunteers are only involved with one organization, this also means your volunteers are deeply committed to your cause and working with your team.
Stat: Women volunteer at higher rates (27.8%) than men (21.8%).
Impact: Women lead the charge in terms of volunteering their time and efforts to organizations.
Stat: People spend an average of 52 hours per year volunteering their time.
Impact: People commit a lot of time to volunteering, which can provide a lot of value for your organization.
Stat: Nearly 60% of companies offer paid time off for employees to volunteer, and an additional 21% plan to offer release time in the next two years.
Impact: Companies essentially pay their employees to volunteer their time, which means your nonprofit has a higher chance of recruiting those employees to help your organization.
Stat: On average, about 30% of employees volunteer their time.
Impact: This means there’s a high chance many of them will be eligible to apply for volunteer grants on behalf of your organization.
Stat: 82% of companies surveyed say employees want the opportunity to volunteer with peers in a corporate-supported event.
Impact: More employees want to volunteer with their peers from their companies, which means there’s a greater opportunity for team volunteer grants and other sources of support for your nonprofit.
Online Giving Statistics
Stat: Total online revenue grew by 32% in 2020.
Impact: This is a huge amount of growth, far above typical year-over-year reports.
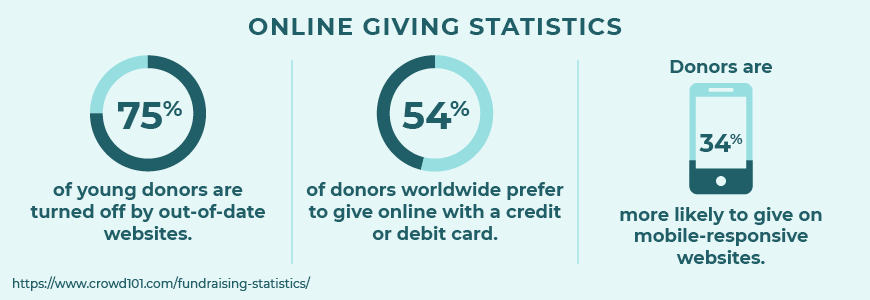
Stat: 75% of young donors are turned off by out-of-date websites.
Impact: Nonprofits need to maintain their websites to ensure their visitors have a positive user experience, which in turn encourages more donations.
Stat: Donations made on a branded donation form are, on average, 38% larger than contributions made through a generic PayPal page.
Impact: Building your organization’s brand is important, and your donation page is no exception. Incorporate a branded donation page to maintain consistency and make donors more comfortable giving to your nonprofit.
Stat: 54% of donors worldwide prefer to give online with a credit or debit card.
Impact: Offering the opportunity to donate via credit or debit card can significantly boost your fundraising revenue.
Stat: In 2020, the average online donation amount was $177.
Impact: This is a $29 year-over-year increase.
Stat: 51% of high-wealth donors (giving $200k+) prefer to give online.
Impact: The easier you make it to give to your organization online, the more accessible it’ll be when high-impact donors want to give.
Stat: Donors are 34% more likely to give on mobile-responsive websites.
Impact: When your website is easily viewable on a mobile device, donors will be more likely to give to your nonprofit.
Stat: When influencing donors, online resources are 20% more useful than direct mail.
Impact: Everything is online these days, which means your donation resources should be, too. Make everything easily accessible to your donor base.
Crowdfunding Statistics
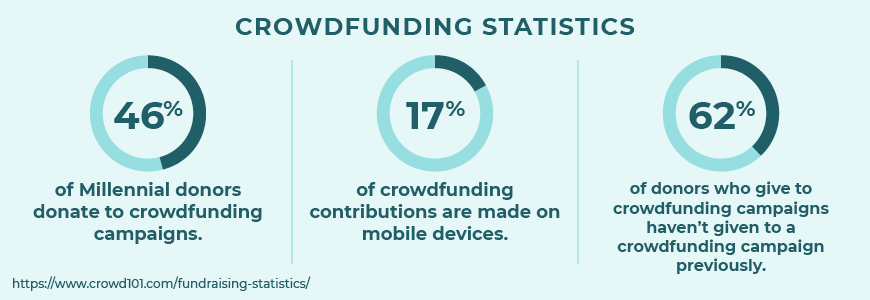
Stat: 46% of Millennial donors donate to crowdfunding campaigns.
Impact: Crowdfunding campaigns are popular among younger donors. This means your organization should make sure your marketing targets individuals in this age category.
Stat: 14% of donors have created an online peer-to-peer fundraising campaign.
Impact: A good portion of donors have become peer-to-peer fundraisers for organizations they support, which increase a nonprofit’s revenue beyond general crowdfunding.
Stat: The average amount a nonprofit crowdfunding campaign raises is $9,237.55.
Impact: Crowdfunding campaigns can result in a large amount of revenue for your nonprofit.
Stat: The average amount an individual raises via crowdfunding is $568.
Impact: Individual fundraisers can still raise enough to make an impact via crowdfunding.
Stat: 17% of crowdfunding contributions are made on mobile devices.
Impact: Ensure your crowdfunding campaigns are easily accessible on mobile devices so donors who prefer to give this way can do so.
Stat: Social media has a huge impact on crowdfunding success. For every order of magnitude increase in Facebook friends (10, 100, 1000), the likelihood of success increases drastically (from 9%, to 20%, to 40%).
Impact: Make sure your team effectively promotes your crowdfunding campaigns on social media.
Stat: 62% of donors who give to crowdfunding campaigns haven’t given to a crowdfunding campaign previously.
Impact: A majority of donors to a crowdfunding campaign are new to crowdfunding. This means a lot of your support will come from first-time donors.
Stat: Crowdfunding campaigns with personal videos raise 150% more than those that don’t feature videos.
Impact: Including visuals on your crowdfunding campaign page, especially videos, will inspire more donors to give.
Stat: Individuals between the ages of 55 and 64 are the most generous crowdfunding donors.
Impact: In addition to Millennials, Baby Boomer donors are another important age category to target for crowdfunding campaigns.
Recurring Giving Statistics
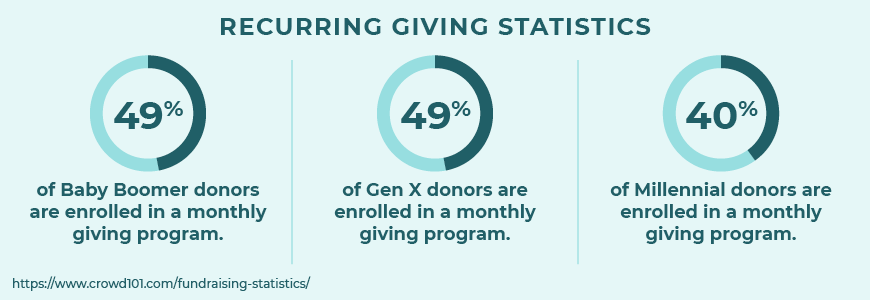
Stat: 49% of Baby Boomer donors are enrolled in a monthly giving program.
Impact: Almost half of donors in this age category give on a recurring basis, which means it’s essential that your organization offers a recurring giving option.
Stat: 49% of Gen X donors are enrolled in a monthly giving program.
Impact: As with Baby Boomer donors, about half of Gen X donors also give on a recurring basis. Because these age categories make up a large portion of the population, make sure recurring giving options are prominent on your donation forms.
Stat: 40% of Millennial donors are enrolled in a monthly giving program.
Impact: Though fewer Millennial donors are enrolled in recurring giving programs than Baby Boomer and Gen X donors, this is still a growing portion of the population that will likely become more philanthropic over the years.
Stat: The average annual donation total for recurring donors is $412.
Impact: Recurring gifts add up! When donors can give in smaller increments over time, their annual donations increase.
Stat: Pre-selecting monthly giving on your donation page can increase conversions of monthly donations by up to 35%.
Impact: Consider adding a default option of recurring giving to actively encourage donors to choose this option, rather than making a one-time gift.
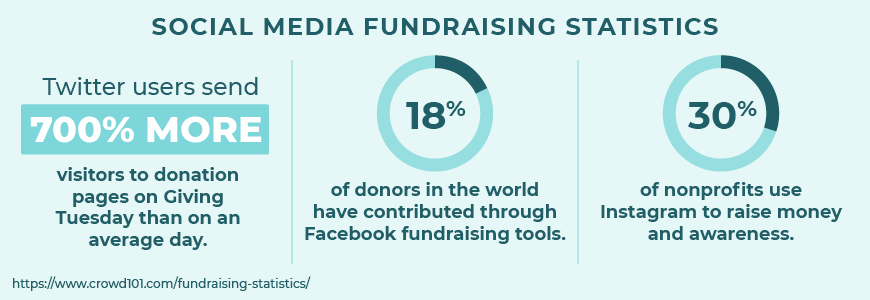
Social Media Fundraising Statistics
Stat: Revenue from Facebook fundraising tools increased by 14% in 2020.
Impact: Hunger and poverty nonprofits saw a 946% increase in revenue from Facebook.
Stat: 18% of donors in the world have contributed through Facebook fundraising tools.
Impact: While social media fundraising does not yield the highest donation rate, it’s still a sizable source of donations.
Stat: 88% of the donors who have given through Facebook fundraising tools report that they will likely do it again in the future.
Impact: Facebook is a powerful social media channel to use for fundraising.
Stat: More than 29% of mobile donation traffic on Giving Tuesday came from Facebook.
Impact: For organizations taking part in Giving Tuesday, Facebook yields almost a third of mobile donation traffic.
Stat: Twitter users send 700% more visitors to donation pages on Giving Tuesday than on an average day.
Impact: Be sure to encourage your staff and supporters to share your donation page on social media during Giving Tuesday! This will send far more traffic to your page than on a normal day.
Stat: 30% of nonprofits use Instagram to raise money and awareness.
Impact: Since nearly a third of nonprofits use Instagram to raise awareness for their causes, this is a great channel to consider as you perform outreach for your organization.
Stat: 87% of donors who first donate from a social referral source make their second donation from a social referral source.
Impact: Social media makes an impression on donors! A majority of donors who give after being referred by a social media source will likely give a second time through social media.
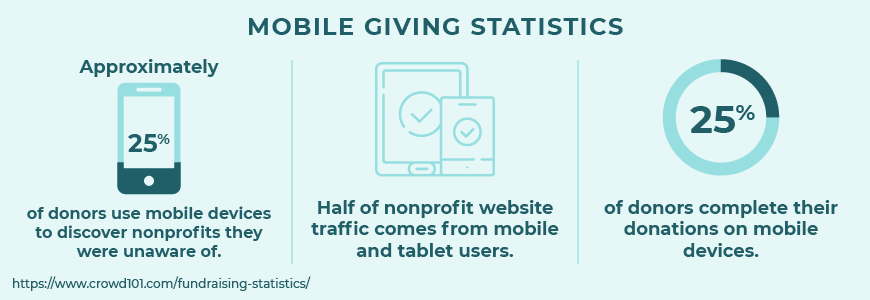
Mobile Giving Statistics
Stat: Nonprofit mobile audiences grew by 26% in 2020.
Impact: This is a huge increase in mobile audiences for nonprofits over the previous year.
Stat: Approximately 25% of donors use mobile devices to discover nonprofits they were unaware of.
Impact: Because a quarter of donors discover nonprofits they didn’t know about via mobile devices, making your nonprofit easy to learn about on a mobile device is incredibly important in terms of fundraising.
Stat: Half of nonprofit website traffic comes from mobile and tablet users.
Impact: Ensuring your nonprofit’s website is mobile friendly will keep mobile visitors on your site.
Stat: 25% of donors complete their donations on mobile devices.
Impact: Because a quarter of donors are giving on mobile devices, make sure your donation process is mobile friendly so visitors don’t abandon the donation page.
Stat: Using a mobile-responsive design on a nonprofit website can increase donations by 126% on average.
Impact: The easier it is for donors to navigate your nonprofit’s website from a mobile device, the more funds you’ll raise.
Stat: The average text-to-give donation is $106.
Impact: Though lower than the average online donation amount, text-to-give is still a viable option for nonprofits.
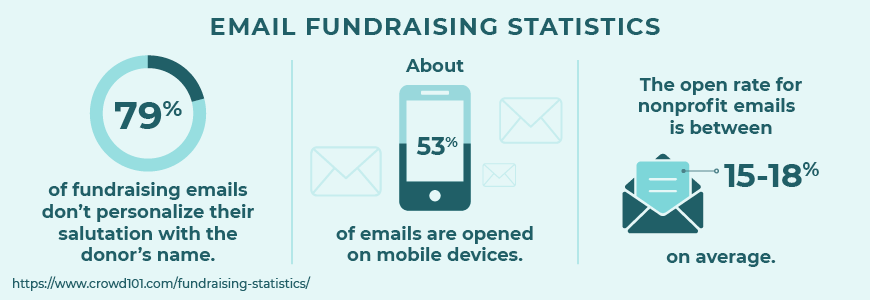
Email Fundraising Statistics
Stat: Email messaging accounts for one third of all online revenue.
Impact: Don’t let your email strategy fall to the wayside! Email fundraising can bring in a large portion of your revenue.
Stat: Email list sizes increased by 3% in 2020.
Impact: This is the same growth reported in 2019.
Stat: 79% of fundraising emails don’t personalize their salutation with the donor’s name.
Impact: Personalization is key. Donors won’t feel valued or appreciated if you don’t address them by name in your communications.
Stat: The open rate for nonprofit emails is between 15-18% on average.
Impact: Because the open rate is relatively low for nonprofits, it’s important to personalize your emails, keep it simple, and encourage engagement.
Stat: For every 1,000 fundraising emails sent out, nonprofits raise an average of $45.
Impact: It’s important to finetune your email fundraising strategy so you can target the appropriate segments and send out the number of emails you need to meet your goals.
Stat: Nonprofits miss out on approximately $14,000 per year because 12% of their emails are marked as spam.
Impact: Nonprofits should ask recipients to add them to their address book, use accurate subject lines and sender information, and incorporate other strategies.
Stat: About 53% of emails are opened on mobile devices.
Impact: It’s essential that nonprofit emails are optimized for mobile to ensure easy readability.
Stat: The average nonprofit email click-through rate is 2.66%.
Impact: To increase your click-through rate, make sure your email recipients are appropriately segmented, your calls-to-action are clear and direct, and that you maintain a consistent brand.
Stat: Nonprofits sent an average of 59 email messages per subscriber in 2020.
Impact: This was a 17% increase in volume.
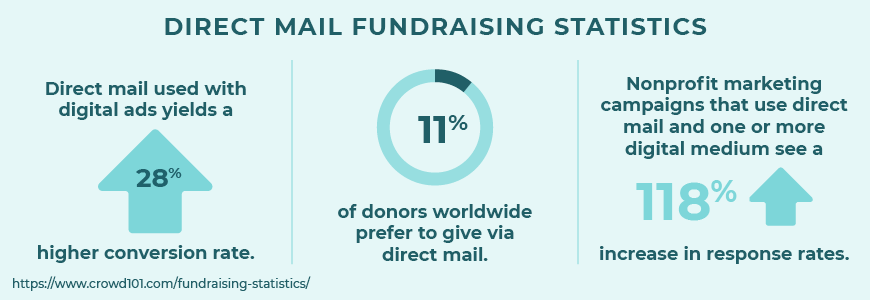
Direct Mail Fundraising Statistics
Stat: 24% of Baby Boomer donors say they were encouraged to give an online donation because of direct mail they received.
Impact: Direct mail isn’t dead! This channel can still be used to engage with donors and encourage them to give in multiple ways.
Stat: Oversized envelopes have the greatest household return on investment (ROI) over other mediums, at 37%.
Impact: This comes out ahead of postcards and letter-sized envelopes, which are at 29%.
Stat: Oversized envelopes also have the largest household response rate over other mediums, at 6.6%.
Impact: Postcards have a response rate of 5.7% and letter-sized envelopes have a response rate of 4.3%.
Stat: Direct mail strategies combined with digital ads yields a 28% higher conversion rate.
Impact: This means direct mail and digital work well together.
Stat: Nonprofit marketing campaigns that used direct mail and one or more digital medium saw a 118% increase in response rates.
Impact: This higher response rate is in comparison to using direct mail only.
Stat: 11% of donors worldwide prefer to give via direct mail.
Impact: While it’s not the most common method of giving, direct mail is still an option that some donors prefer.
School Fundraising Statistics
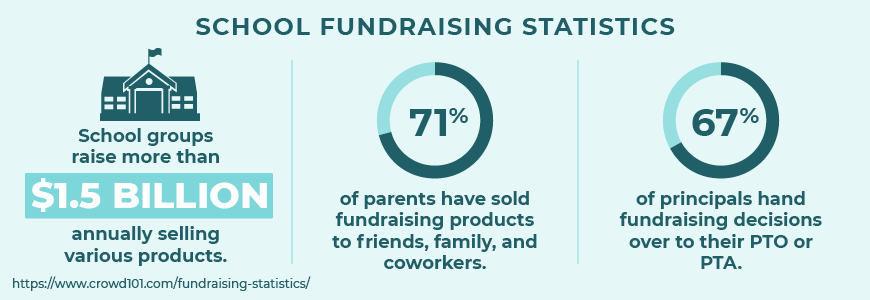
Stat: School groups raise more than $1.5 billion annually selling various products.
Impact: Product fundraising has a sizable impact on schools.
Stat: 35% of schools average less than $5,000 in annual earnings from fundraising. Meanwhile, 27.1% earn more than $75,000.
Impact: School fundraising efforts have the potential to produce a large amount of revenue.
Stat: 71% of parents have sold fundraising products to friends, family, and coworkers.
Impact: School fundraisers are commonplace enough to the point where almost three-quarters of parents have participated in them.
Stat: 67% of principals hand fundraising decisions over to their PTO or PTA.
Impact: Experts believe this practice actually may hamper a fundraiser’s success. Instead, principals should take a hands-on approach.
Sources
America’s Charities
The Blackbaud Institute
Campaign Monitor
Charity Navigator
Double the Donation
M+R Benchmarks Study
Network for Good
Nonprofits Source
Nonprofit Tech for Good
NPTrust
Snowball Fundraising
CauseVox